Mapping for Kids: Cool Competition For Your Mapping Skills

Dr Karen Joyce
Dr Karen Joyce
19 Apr 2021
mapping for kids she maps

I have one question for you to start with… How cool is your school?

Not the cool in terms of awesome, but in the more traditional sense of it is cool because it’s shady and it’s got a lot of green space.

So why is that important? When we think about urban planning, for example, we consider green, grey, and blue infrastructure. Green being our trees and generally our green spaces, blue being the water, and grey being the impervious surfaces, the buildings, the roads, the footpaths etc.

In this ‘Map My School’ program (with access to FREE resources at the bottom of this blog) we are really interested in looking at the amount of green infrastructure within the school context. This could also be extended to other places within our communities too.

Many schools have spaces that are concrete jungles, they’re hot and noisy, with the sound and the light reverberating around the space. Then we have some really beautiful school spaces where there are lots of trees. There are lots of natural shapes and it has a calming effect, and they are cooler. It also has an economic benefit by reducing the amount that is spent on air conditioning.

Natural green spaces also have the benefit of transpiration with the trees. So, they’re cooling the air around them, not just providing shade. Working in schools we know that if you can get kids outside and playing rather than hanging in the hallways at the school, it’s better for general health and wellbeing as well.

So with that, I’d like to introduce you to a program that we’ve been running over the past couple of years and how it fits into the STEM curriculum.

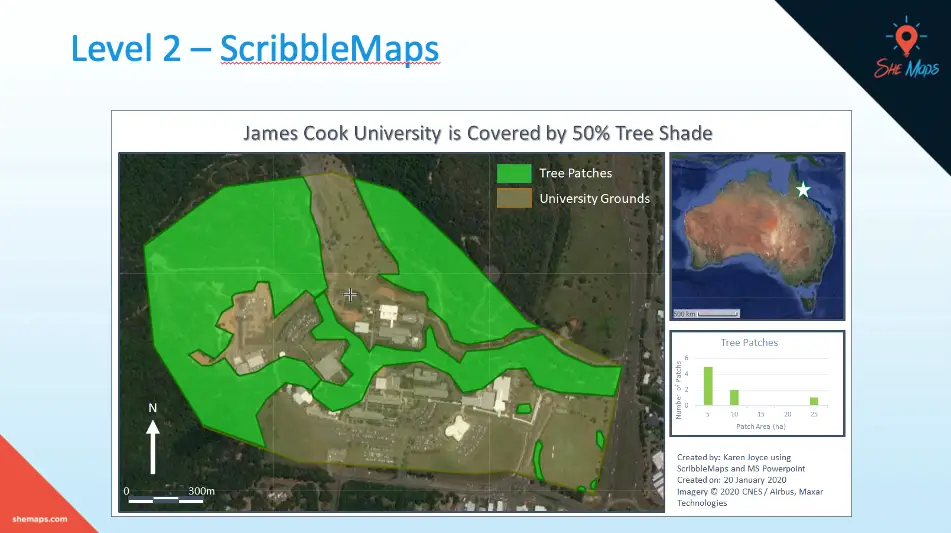
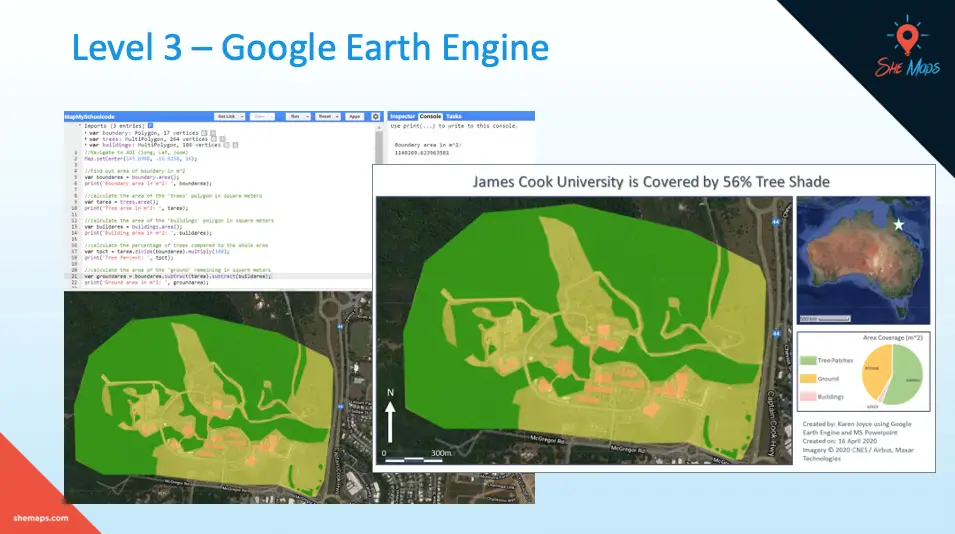
It’s called Map My School

People like to use different aspects of STEM (science, technology, engineering and maths) in silos but this activity is an integrated project that you can run in your classrooms that ticks off science, technology, engineering, and maths as a nice holistic project. Here is how we do this…

  • Science – We will explore the role of trees, shade, and thermal comfort on your school grounds.

  • Technology – We will use free programs to analyse drone or satellite data of your school grounds. You can also use some data loggers for some extension activities.

  • Engineering – Your students will develop techniques to better understand, plan, organise, monitor, and manage your school campus or chosen community space to make better use of green, grey, and blue infrastructure.

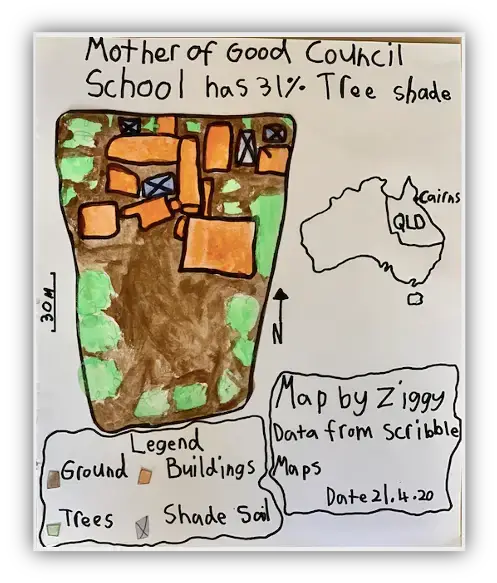
  • Maths – Finally we calculate the areas and percentages, and we discuss units of measurements.

And then just for good measure, how about we create a poster at the end of that to communicate the findings, and bring some creative expression in so we get the A (art) into STEM!

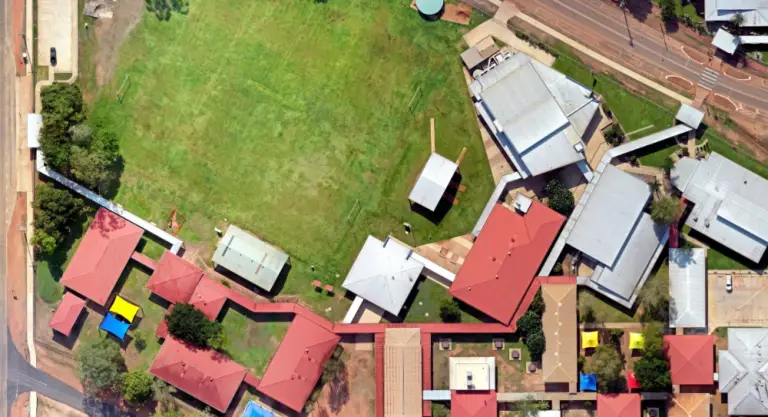
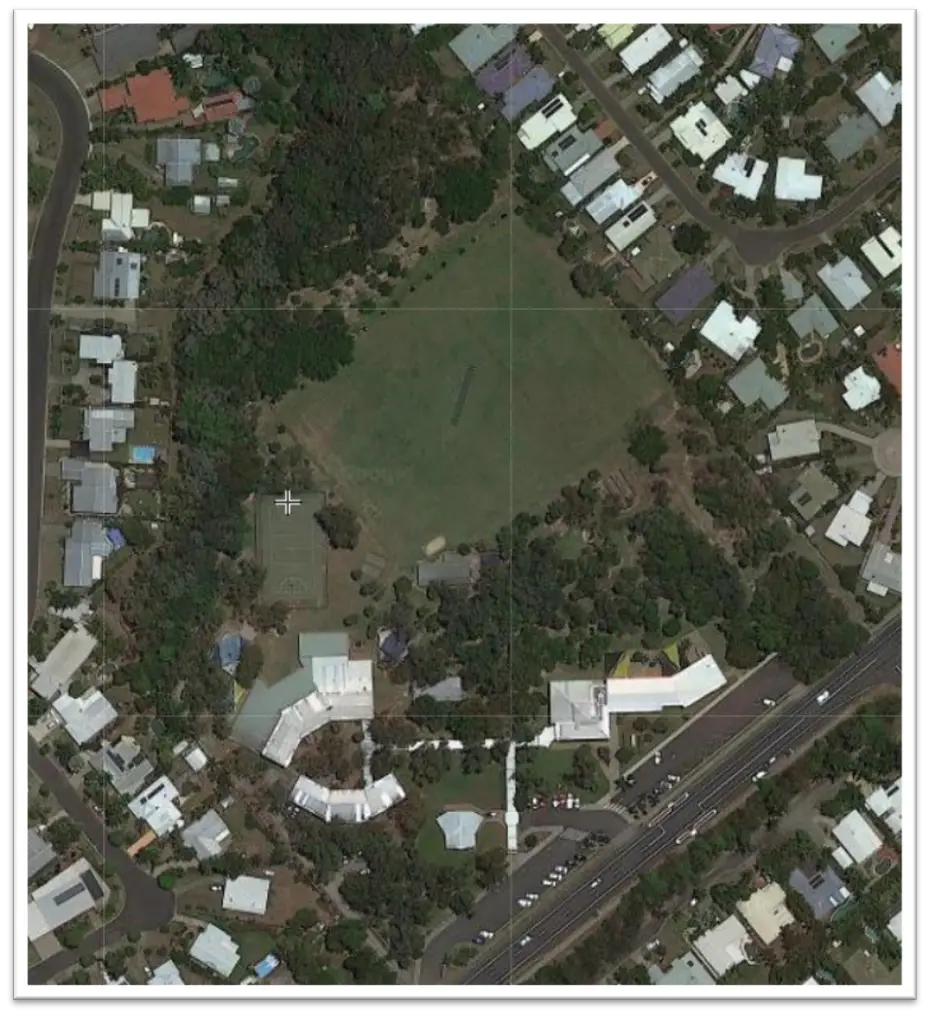
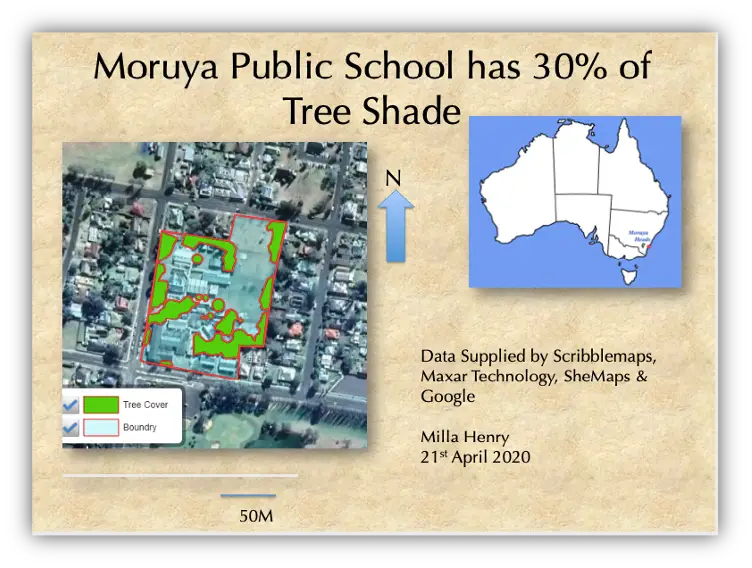
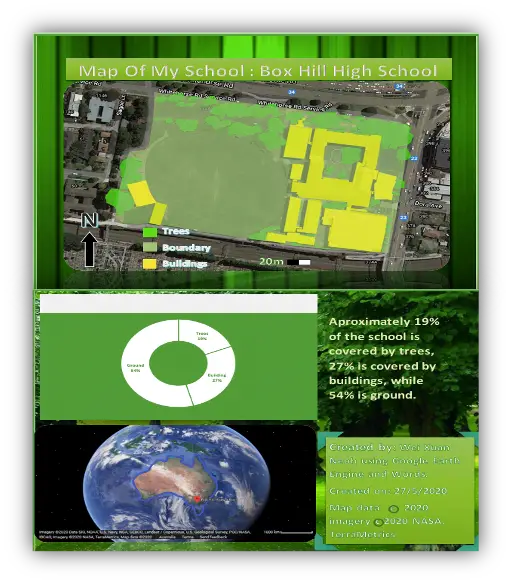
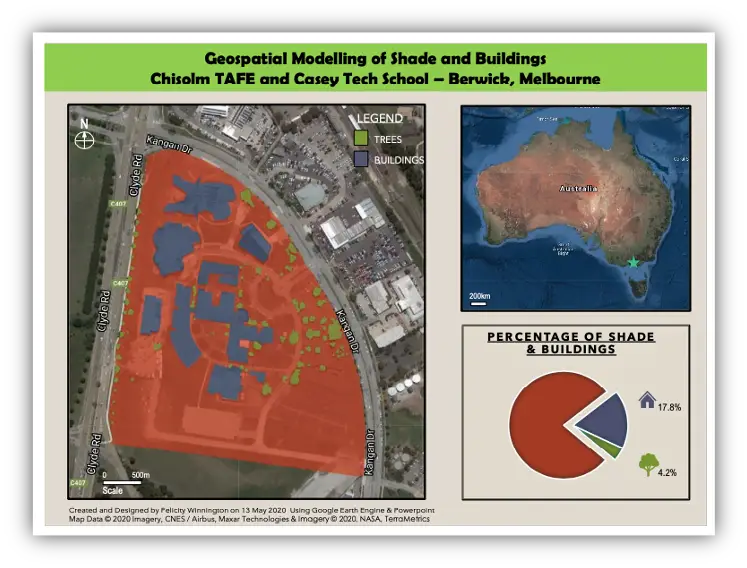
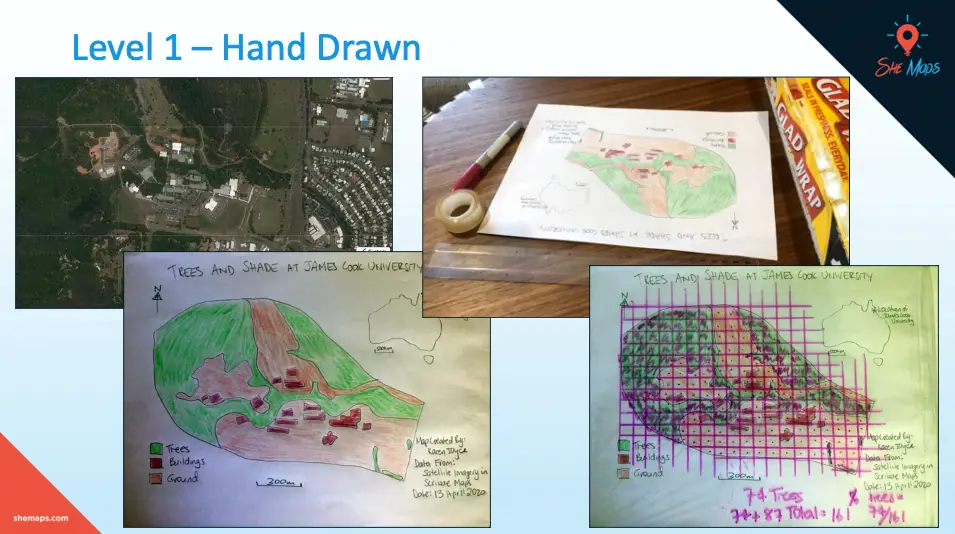
Here are two examples of two different schools from satellite imagery 

  • The example at the top actually has quite a lot of green space and it’s actually really beautiful to walk through the walkways and it feels really calming.

  • Now the school underneath actually has probably three times as many students as the first one, but it has very little green space. There are some shaded spaces, but it’s shaded in terms of grey infrastructure.

mapping for kids aerial photo of a school with lots of shade

A school with lots of shade

mapping for kids aerial photo of a school with less shade

A school with very little shade

If we calculate the percentage of green infrastructure or green shady space that we have in those schools, then our students can come up with some solutions to maybe make it a little bit greener and more of an inviting space to be in.  

So here are some examples of students who have entered our Map My School competition before, and you can see a variety of different student levels as well.

mapping for kids map of mother of good council school that shows it only has 31% tree shade
mapping for kids a map of Moruya Public School showing it has 30% tree shade
mapping for kids aerial photo of Box Hill High School
mapping for kids GIS modelling of Chisolm TATE and Casey Tech

To differentiate the learning within your classroom or across different grades, there are three levels of this STEM education program that can be taught. Whilst all the students work to solve the same STEM problem, the structure of this program allows you to decide which level is best suited for your student’s abilities or choose to implement the program to facilitiate different skill levels within the one class.

Level 1 – Hand Drawn Maps 

This is great for your early grade students. I’ve traced over a satellite image of James Cook University, as my example, and I’ve coloured in the areas of the trees, the buildings, and some background there as well. I’ve just gone through and used some glad wrap, or can you use tracing paper, to draw a grid and calculate the number of squares that have trees vs those that don’t.

mapping for kids Level 1 hand-drawn GIS map

Level 2 –  ScribbleMaps 

For level two, we use an online program called ScribbleMaps. We use the free version and no login is required. It uses satellite imagery in the background, just like what you might see on Google Earth. And the students will then go through and draw the boundaries using digital tools.

mapping for kids Level 2 Scribble Map of James Cook University

Level 3 – Google Earth Engine 

Our level three is similar once again but challenges the students to use JavaScript to calculate the areas of shade. Students will use Google Earth Engine to create a digital map of their school, showing the amount of shade versus buildings, and then use Javascript coding to calculate the area. There’s quite a lot of repetition to help the students to gain confidence in using various calculations and then running that code to get their answers. Continuing on from Google Earth Engine, you can do all sorts of machine learning which is a really great area to grow into.

Students will use Google Earth Engine to create a digital map of their school, showing the amount of shade vs buildings, and use Javascript coding to calculate the area. 

mapping for kids Level 3: Mapping James Cook University on Google Earth engine

Presenting the Findings & Cartographic Conventions 

And then of course the final product is still creating that map with some graphs to represent their shade data. Each student should produce a map that meets cartographic (mapping) conventions.

  • Border – shows the map boundary
  • Orientation – a north arrow shows the correct direction
  • Legend – explains colours, features, symbols
  • Title – what the map is about
  • Scale – for measuring distance
  • Sources – who owns the data, map creator, date

Mapping Extension Activities 

We have also developed further extension activities for teachers who want to make mapping your school a larger focus. These extension activities continue with the important role of trees and shade on your school campus to mapping vegetation at a larger scale by investigating green spaces in cities around the world and here in Australia. These extra lessons explore themes such as sustainability, liveability and ecological footprint in urban environments by discovering how to make our concrete jungles ‘greener’ in a world of increasing urbanisation and climate change.

Extra Resources

To really get into the nitty-gritty of this program, then we highly recommend that you watch this video presented by Dr Karen Joyce.  In this video, Karen explains in greater detail each level and what you can expect.  

Click here or the image below to watch the video.

How Cool is Your School presentation by Dr Karen Joyce

If you are wanting to take this geospatial learning to another level, then we can really extend your students into gathering their own imagery with sub 2kg drones and creating their own orthomosaics. We have a full online Teacher Professional Development as part of our online membership, ORBIT. Find out more

If you’ve enjoyed this article, then you might also enjoy reading, The Melbourne Map: Bringing Magic to Mapping or 2 EduDrone Takeaways to Include in Your Mapping Curriculum

About She Maps.

She Maps is Australia’s leading expert in drone and geospatial education. 

She Maps assist schools with the purchasing of drones, school-industry created drone and geospatial teaching resources and highly supportive teacher professional development.

 
You’re in Safe Hands!
She Maps is a CASA approved commercial operator to fly microdrones indoors with students and teachers. CASA holds commercial operators, to a higher standard than recreational users and educators. This means that She Maps has been assessed by CASA as having rigorous training and risk mitigation procedures in place.
 

Ready to buy drones for your school? We are an authorised DJI reseller in Australia

Want some help?

Schedule a call with one of our team members to get some personalised recommendations.
picture4
Share
Tweet
Share
In this article:
    Add a header to begin generating the table of contents

    Stay up to date

    Subscribe by email and never miss a blog post or announcement.

    Flying High with Drones at Your School!

    Learn the 6 Steps to Launching a Successful Drone and Geospatial Program at your School

    What’s covered:
    • The educational benefits for running a drone & geospatial program
    • How to gather whole school support for the program
    • How to fund your drone program
    • Matching your school requirements to the best program
    • How to build teacher confidence and capabilities
    • Steps to expand your program with school-industry partnerships

    Try before you buy

    Take our resources for a spin and join the thousands of teachers who love our ready-to-teach classroom materials. Try one of our complete units of work for free.

    drones in forestry yr 5 6
    drones in forestry yr 9 10