
This article enlightens teachers on how to use Esri StoryMaps in the geography classroom.
In my previous blog I introduced ArcGIS StoryMaps and outlined how they integrate narrative text, interactive maps, and multimedia content, to tell immersive stories about people, places and the environment. There are now more than one million StoryMaps published publicly by a variety of government agencies, NGO’s, universities and individuals… but how do you find the best ones to use in your geography classroom?
The essence of geography is how humans interact with their environment and StoryMaps are a very accessible resource for geography teachers to showcase global issues via digital storytelling to their students.
StoryMaps can highlight key geographical concepts of place, space, environment, interconnection, sustainability, scale and change and can also help students apply these concepts to a wide range of places and environments at the full range of scales, from local to global, and in a range of locations.
In the classroom, they can help students to apply these geographical concepts, synthesise information from various sources, draw conclusions based on the analysis of data and information, taking into account alternative points of view.
Check out Joseph Kerski’s Teaching and Learning with ArcGIS StoryMaps
Viewing a StoryMap on a chosen global issue can also help students:
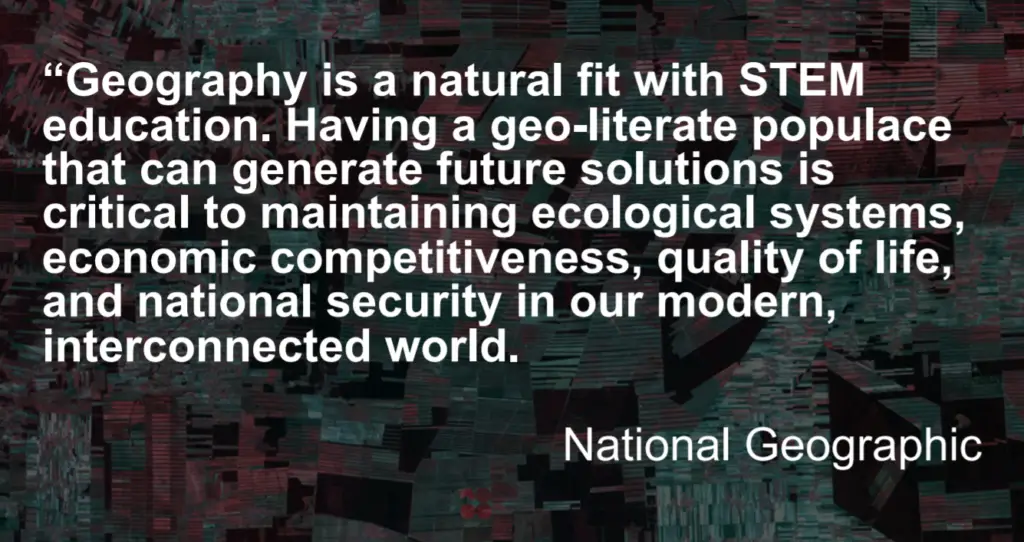
Geography helps develop 21st century skills that students need to prepare them for higher education, work and engagement in a complex and rapidly changing world.
The Australian Curriculum mandates that in Year 7 to 10 Geography, spatial technology use is explicitly specified in the Geographical Inquiry and Skills strand.
StoryMaps are a perfect way to introduce your students to Geographic Information Systems (GIS) as they show different layers of information in an interactive map that is easy to explore and engage with. Exposing junior geographers to spatial technology via StoryMaps can show the array of data available in ArcGIS Online and ESRI’s Living Atlas. This prepares junior geographers for Senior Geography where students need to demonstrate the use of spatial technologies to produce their own maps for assessment.
La Palma eruption teaching resources created by Jason Sawle at Esri UK, is a collection of classroom ready GIS based applications for teaching about the La Palma eruption.
To further explore the options of using GIS in your classroom have a look at Esri Australia’s StoryMap on Implementing GIS into your school’s curriculum and Brett Dascombe’s StoryMap EduDrone – Spatial Technology toolbag for teachers.
Sustainability is a key geographical concept and a cross curriculum priority for the Australian curriculum and you will find a plethora of relevant StoryMaps about the SDGs.
SDGs Today is an excellent website that provides many collections of Story Maps about each of the 17 Sustainable Development Goals for 2030. This platform integrates a variety of tools and resources that give access to timely, geospatial data about the SDGs.
Go to The Sustainable Development Solutions Network Collection and start with the first Story Map called SDGs Today which introduces the purpose of the website and how you can access the Data Hub, Storytelling and Education pages.
Finding the best StoryMaps that match to the geography content being taught in our secondary schools can be time consuming…so how do you find the best ones to use in your geography classroom? A good place to start is on the esri website Explore Stories but if you haven’t got the time, we’ve done it for you! We matched each of the ACARA geography units below to some of the best StoryMaps examples that are publicly available at the moment.
This StoryMap will engage students with the perspectives of Aboriginal Peoples and Torres Strait Islander peoples to investigate Indigenous knowledge and water issues at Uluru (Ayers Rock) in the Northern Territory.
Other notable Story Maps for this topic:
Earth’s Biggest Storms: Tropical Cyclones, The Tidal Thames and Drones, GIS and the Townsville floods, Climate: Murray-Darling Basin
This StoryMap follows a Volcano Expedition Team that travelled to Guatemala on a National Geographic-funded expedition to better forecast when eruptions will occur and support communities that live with this risk.
On An Island is a collection of StoryMap lessons designed to encourage geo-literacy skill development in early ArcGIS users by exploring Caribbean landscapes and people
Other notable StoryMaps for this topic:
The Voices of Grand Canyon, Living in the heart of winter, A Story About Great Countries
This StoryMap is a visually stimulating look at the research being conducted at Mt Everest in the Himalayas.
Other notable StoryMaps for this topic:
Peaks and Valleys, Australia’s Black Summer, Dealing with Disasters, Seven Wonders: Natural World, Drones, GIS and bushfire recovery, Landform Regions of Australia, How Deep is Challenger Deep?, Iceland, Great Barrier Reef Hope Spot
This StoryMap explores human population density, urbanisation, transport and communication networks via globe animations, and the extent of the human footprint.
Other notable StoryMaps for this topic:
Grace and Delight, COVID-19 and refugees, The challenges facing Jakarta’s future, The Changing Demographics of Australia (student report), Migration and Public Transport (student report), Urban Africa
This StoryMap is a visually stunning look at the world’s biomes and their distribution, importance and threats and how terrestrial and marine protected areas can save biodiversity.
Other notable StoryMaps for this topic:
Climate & Ugandan Coffee, The Cost of Beef, The Living Land, From Farm to Mess Hall,
The Global lives of Indian Cotton, SEEDS for Recovery, The Diversity of Life: Atlas, (Farm) Animal Planet, The Half-Earth Project, 30X30: A movement to protect a third of our planet’s surface
This StoryMap investigates how the Global Shipping Industry should be held accountable for the extensive damage caused to vulnerable habitats and their communities.
Other notable StoryMaps for this topic:
The Human Reach, The secret life of bridges, Make Way for Whales, Seven Wonders: Engineering Feats, Spatial Change in Nike Sneakers,
This StoryMap looks at how Phillip Island’s iconic wildlife is being impacted by climate change.
Other notable StoryMaps for this topic: Climate Migrants, Living in the Age of Humans, Looking below the surface, Great Barrier Reef, Hot Numbers, Plastic Pollution, Ivory Trafficking, On the brink, Improving Our Coastal Ocean
This StoryMap demonstrates how CARE and their partners in 81 countries have contributed to significant change in 11 of the 17 Sustainable Development Goals
Other notable StoryMaps for this topic:
Measuring Success, Livelihoods, food and futures: COVID-19 and the displaced, An Analysis of the Global HDI Score Methodology, A New Wave of Water Champions
Senior Geography teacher Brett Dascombe from Wavell State High School in Brisbane has just received a Teacher in Excellence Award for his use of spatial technologies in the classroom. His students are producing StoryMaps from Years 7-10 and for Internal Assessment in Senior Geography. He has recently shared this StoryMap to help his students describe, analyse and explain maps and graphs in Senior Geography
StoryMap examples for this unit can help students recognise hazard zones and analyse spatial distribution of the hazard to describe geographic patterns and identify the implications for people and environments.
This StoryMap examines patterns in global wildfires using data from NASA’s Aqua satellite and a GIS to measure change. Aqua and its space sister Terra have been orbiting the planet for around 20 years. The satellites’ MODIS sensor has been used to track changes in the ocean, on land, and in the atmosphere, and since MODIS can also detect small thermal signals, it can also be used to track changes in wildfires.
What’s On Our Plates? is a collection of learning modules for teachers and students interested in learning about Aotearoa New Zealand’s plate boundary, the Hikurangi subduction zone and the Alpine Fault. They are designed as a set and are based on NZ Curriculum
Other notable StoryMaps for ecological hazards:
Where are all the COVID-19 Vaccines?, Malaria on the Frontlines, Mapping the spread of disease
StoryMaps can provide case studies for students to investigate the geographical processes and interactions over time and space that have resulted in challenges for places in Australia and megacities in developing countries.
This StoryMap explores the giant urban agglomerations called megacities visualised through globe animations, and a sidecar immersion with map actions that chronicles the historic growth of 10 of today’s largest cities with side panel images from Esri’s Living Atlas world imagery.
Other notable StoryMaps for this topic:
The Human Reach, Sizing up the City, Protecting Canberra’s Air Quality, Population Challenges in Australia (student report), EO Toolkit for Sustainable Cities & Human Settlements, Urban Africa
Case study specific StoryMaps can help students develop an understanding of changes to the biophysical environment over time, with a particular focus on land cover transformation and climate change and the resulting impacts and challenges posed at global, regional and local scales.
This StoryMap investigates how the Amazon rainforest is approaching a catastrophic tipping point because of massive forest fires and land clearances due to criminal activities such as land clearances, illegal logging, wildcat mining and wildlife trafficking.
Other notable StoryMaps for this topic:
State of the Global Climate 2020, Studying the 2019-2020 Australian Bushfires Using NASA Data, Living in the Age of Humans (collection)
StoryMap examples on this topic can help students develop an understanding of population change, movement and distribution over space and time, and how governments, organisations and individuals respond to the challenges posed by demographic change.
This StoryMap showcases excellent maps of social demographic data (ethnicity, occupation, age, income and housing costs) to identify disadvantaged and marginalised neighbourhoods in Australian cities.
Other notable StoryMaps for this topic:
In search of refuge, No home away from home, Impacts of COVID-19 on refugees and displaced communities (collection)
And if the Esri StoryMaps team had not already made StoryMaps easier to view and build, they created collections giving authors the ability to publish a group of stories of the same theme in the one StoryMap. Here are some notable collections:
A collection of 30 StoryMaps by Mission Blue, a global coalition to inspire public awareness of a worldwide network of marine protected areas in Hope Spot StoryMaps
A collection of over 50 StoryMaps by scientists, conservationists, storytellers, and educators around the world in National Geographic Explorer Stories
A collection of 30 wildfire StoryMaps from the USA in Wildfire Maps
A collection of 21 StoryMaps about New York’s remarkable water system that pipes millions of gallons of fresh water into the city every day and distributes it across its five boroughs in NYC H20 Maps
Additionally, the number of items that it’s possible to place in a collection has doubled from 30 to 60. This makes collections a great way to house content from your organisation and update it whenever you want, like a newsletter or a recurring status update. It’s a great way to collate a series of your favourite StoryMaps with the same theme, or collate StoryMaps like chapters of a book or a series of lessons for a unit of work.
So if you like some of the StoryMaps shown in this blog you can copy their URL addresses and embed the links into your own collection on a specific theme that your students can easily access with the link. And when you come across a new StoryMap on the same theme, you can easily edit and add it to your collection.
As an example,the Esri StoryMaps team uses a collection to update enhancements, resources, and featured stories in 2021 StoryMaps Weekly Waypoint
She Maps is Australia’s leading expert in drone and geospatial education.
She Maps assist schools with the purchasing of drones, school-industry created drone and geospatial teaching resources and highly supportive teacher professional development.

Subscribe by email and never miss a blog post or announcement.
Take our resources for a spin and join the thousands of teachers who love our ready-to-teach classroom materials. Try one of our complete units of work for free.