Map My School
Show your students how to create maps with this interactive unit of work. No drones needed!

Map your school
Our free Map My School activity is a simple set of lessons in which students use satellite data to map the amount of green shade on their school grounds.
Students calculate the percentage of shade and create a map that meets mapping conventions.
This unit of work is ideal for students from Kindergarten to Year 8, and aligns to the Australian Curriculum for HASS, Geography, Digital Technologies, Design and Technologies, Mathematics, and Science.
How to map your school
Choose the right level for your students
Download the teaching resources
Work with students to create their maps
Step 1
Choose a suitable level
There are three different levels for this activity, based on the ability of your students. We have put a recommended age bracket for each, but choose the level that suits your students.
LEVEL 1: Hand Drawn Map
This is the simplest version, best suited for students aged 7 and under.
Students will look at a satellite image of their school, and then produce a hand drawn map of their school, showing the amount of shade vs buildings.
LEVEL 2: Digital Maps GeoNadir
Students will use the online platform GeoNadir to create a digital map of their school, showing the amount of shade vs buildings, and manually calculate each area.
Note, students will need an email address to access the platform.
LEVEL 3: Google Earth Maps
This is a more advanced online digitisation method, best suited for students aged 12+ years old.
Students will use Google Earth Engine to create a digital map of their school, showing the amount of shade vs buildings, and use Javascript coding to calculate the area.
Step 2
Download the Teaching Resources
The following resources are designed to help you with your planning. To get the best results, we encourage you to follow the steps yourself first, before giving it to your students.
The mapping activity will take your students anywhere from 2 – 6 hours, depending on how much effort they put in.
Click on the images below to access the appropriate resource.
Lessons Mapped to ACARA
Foundation – Year 6
Years 7-8

Lesson Sequences
Foundation to Year 6

Years 7 – 8

Assessment Rubrics linked to Australian Achievement Standards
F – 2

Year 3 – 4

Years 5 – 6

Years 7 – 8

Step 3
Produce Your Map
Each student should produce a map that meets cartographic (mapping) conventions.
We recommend using the BOLTSS framework, ensuring students include a border, orientation, legend, title, scale and the sources used to create the map.
Mapping Conventions: BOLTSS
- Border - shows the map boundary
- Orientation - a north arrow shows correct direction
- Legend - explains colours, features, symbols
- Title - what the map is about
- Scale - for measuring distance
- Sources - who owns the data, map creator, date
Beyond this, it is truly an art to making an aesthetically pleasing map. Experiment to see what works for you!
More reasons to try our Map My School
resources
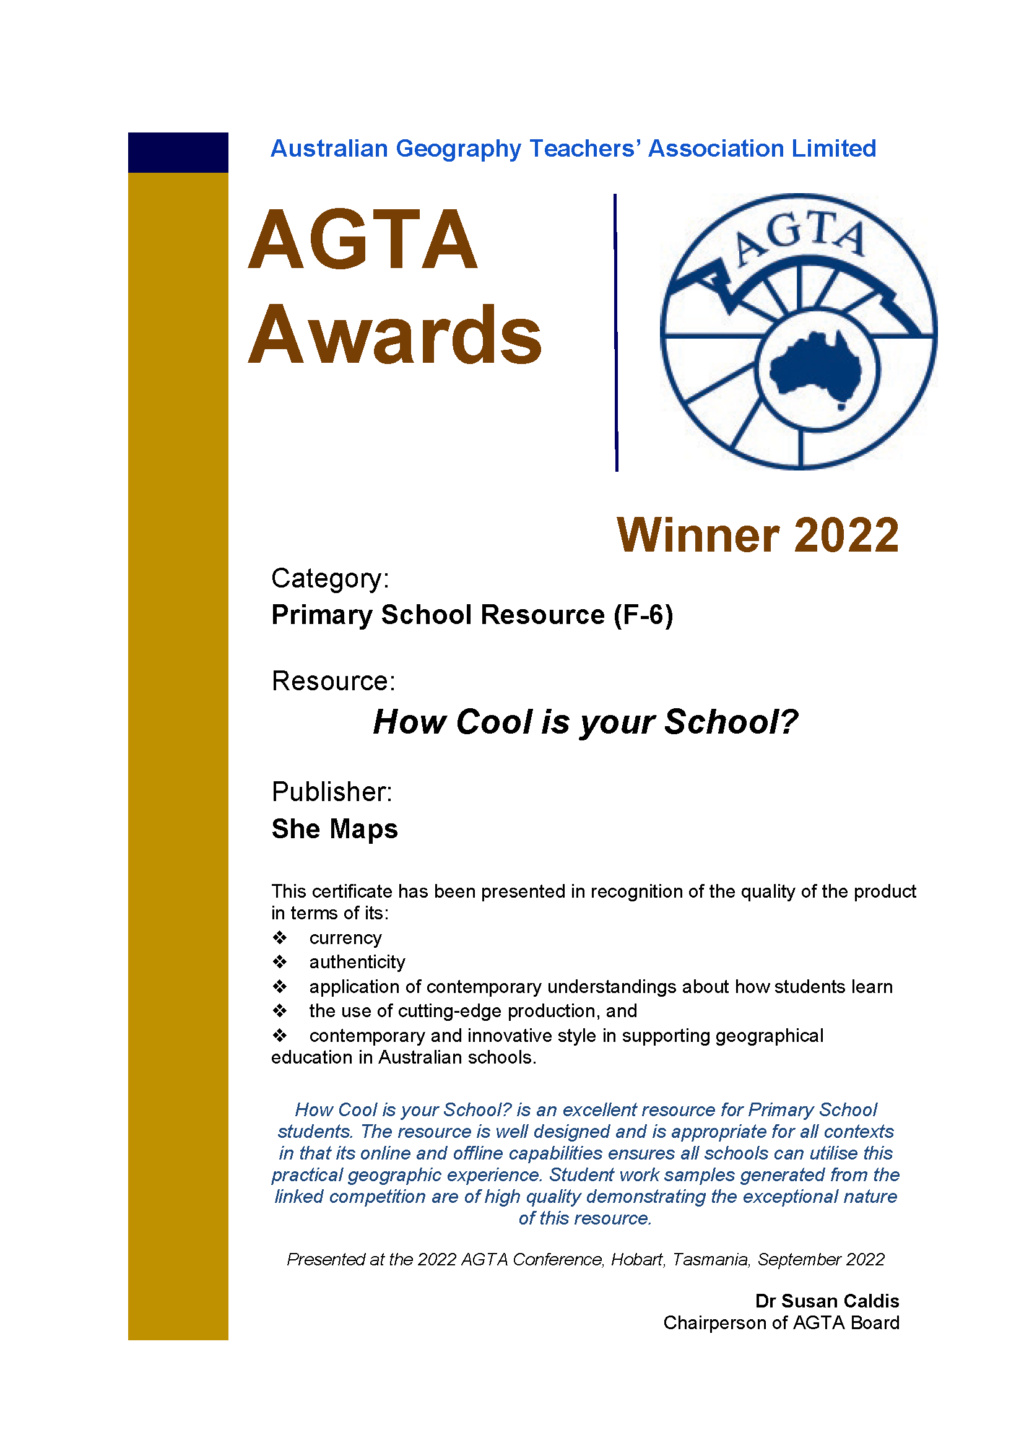
Our Map My School resource has been used and loved by thousands of teachers all around Australia, and the student maps we have seen created over the years across year levels speak for themselves. Kids all ages love this hands-on activity and for many schools, the calculation of green shade by students (see activity below) has led to raised awareness among the school leadership team that there is a lack of shade on many school grounds and more trees and green spaces are desirable. We are proud our resource won “Best Primary Resource (F-6)” in the Australian Geography Association Awards 2022.
WINNER - BEST PRIMARY RESOURCE (F-6)
Australian Geography Association Awards 2022.
“How Cool is your School? is an excellent resources for Primary School students. The resource is well designed and is appropriate for all contexts in that its online offline capabilities ensure all schools can utilise this practical geographic experience. Student work samples generated from the linked competition are of high quality demonstrating the exceptional nature of this resource.”
Dr Susan Caldis
Chairperson of AGTA Board
Presented at the 2022 AGTA Conference, Hobart, Tasmania, September 2022
Can your students dream up some cool ideas of keeping your school cool?
Extend your students learning and thinking, by getting them to perform a Shade Audit of your school.
Using the maps the students have already created for the competition, encourage your students to ascertain the percentage of coverage for each of different types of available shade.
- Tree Coverage (Natural Shade)
- Buildings
- Hard Surfaces – carpark, driveway, concrete, and asphalt, walking paths
- Open Spaces – lawn, garden beds, and open spaces
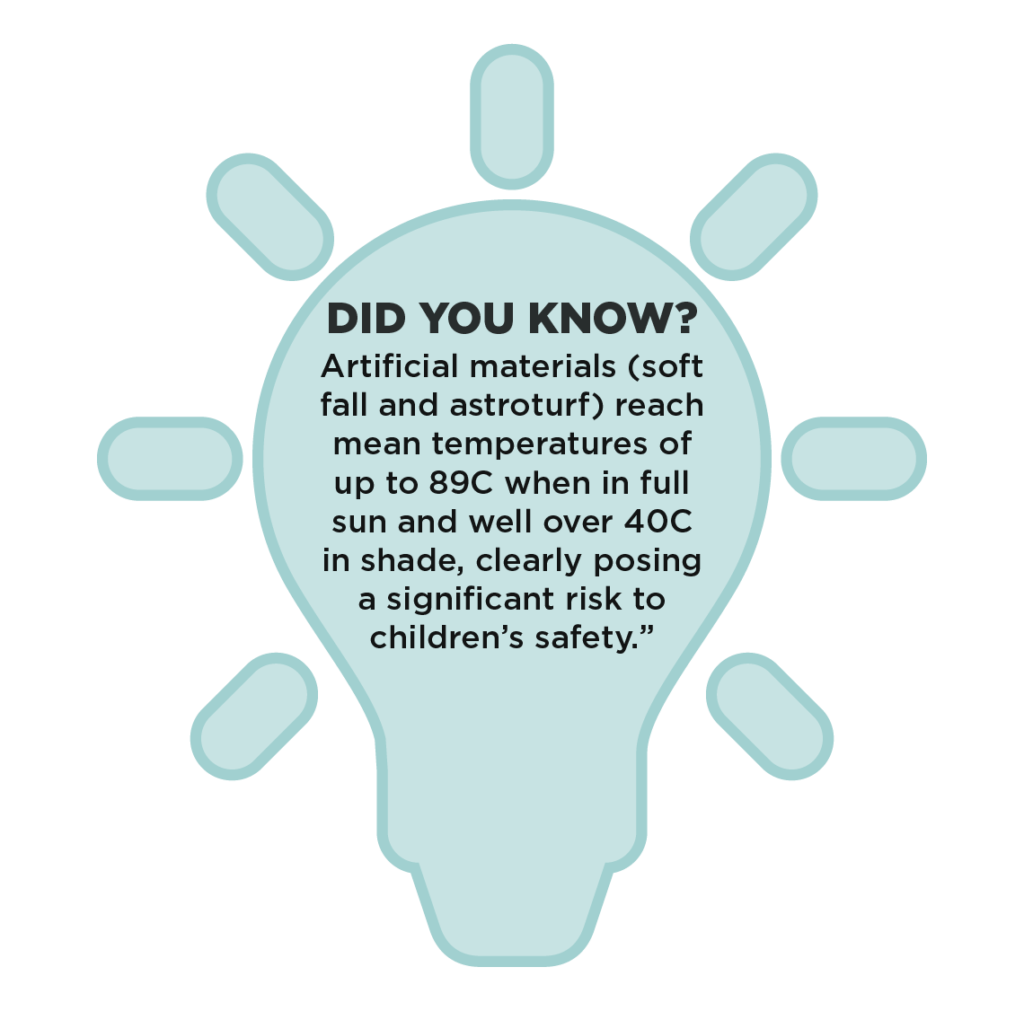
- Artificial Shade Coverage – Sails, pergolas, verandahs, and covered decks
“In a warming world it is a fundamental requirement to counter the negative impacts of heat on learning by providing heat-smart outdoor learning environments where children thrive”. Assoc Prof Sebastian Pfautsch, Western Sydney University, lead author of the School Microclimates Report.
The importance of shade at your school (aka the Science)
In 2021, the ‘How Cool is your School’ competition revealed that a large majority of schools that entered the competition currently have less than 15% available shade. This can make for a hot, uncomfortable learning environment in our Australian climate (excluding when they are in their air-conditioned classrooms of course).
“Rising temperatures and the increasing frequency of extreme heat events across NSW and Australia pose significant health and safety risks to children, yet little is known about thermal comfort of students and teachers in Australian schools.”
Emerging evidence suggests that heat has a negative impact on learning, including lowering “cognitive capacity under thermal stress” and poses “significant health and safety risks to children” says Assoc Prof Sebastian Pfautsch, Western Sydney University, lead author of the Cool Schools Report.
By extending your students (and continuing to practice your mapping skills, we encourage all educators to guide the students to complete a Shade Audit of your school. The students will be empowered to think critically and sustainably about how they can increase the amount of shade available at their school. We want them to lobby for change!
School Microclimates
Cool Schools
Guidelines to Shade
Frequently Asked Questions
Yes. No login is required. Students take a screenshot after they have completed their map. Screenshots can be found in the photos on the iPad.
Yes. However, a login is required for Google Earth Engine and for many schools this can be a show stopper. For this competition, we recommend that schools only use Google Earth Engine for those students who will be using javascript or python coding to create their maps. The GeoNadir website will provide your students with everything they need to complete the task. It’s not a deal-breaker, we’d just prefer everyone to use the same platform for each level.
If you prefer, students can install the Python API and use that instead of Javascript. It won’t affect the outcome of the map.
No login isn’t required for GeoNadir to participate in the mapping competition. Please let us know if you experience any difficulties or access issues with GeoNadir at your school.
If your school is using the larger drones, then we highly recommend that you set up an account and use GeoNadir as a central repository for storing, managing and processing your drone images.
We encourage students to use GeoNadir for levels 1 and 2 of the competition.The GeoNadir website will provide your students with everything they need to complete the task. Google Earth doesn’t have the same functionality as GeoNadir for students completing level 1 of the task. It’s not a deal-breaker, we’d just prefer everyone to use the same platform for consistency.
Google Earth allows students to view online maps including satellite maps. Google Earth Engine allows students to interact with Google Earth using either javascript (the default language) or python (an optional add on). Google Earth Engine is ideal for students in Years 7 and 8 who are learning to use general purpose programming. In our explanatory video, Karen steps students through the code so they can understand its purpose and see changes happen in real time. Because a login is required for Google Earth Engine, for many schools this can be a deal breaker so if teachers prefer to complete level 2 of the competition that’s fine. They will need to use GeoNadir for level 2 as Google Earth alone doesn’t have the ability to draw polygons on the map.
No personal details are required to use GeoNadir. It’s free and easy to access. Head to https://data.geonadir.com/ to get started.
To stay up to date on everything She Maps related, including new resource announcements, upcoming initiatives and product discounts, sign up for our newsletter here – https://shemaps.com/signup-page/
Need Help?
We are here to help you be successful with this in your home, classroom, or where ever you are learning!
Ask us via Facebook @Shemaps
Email us at [email protected]